We have been using echo for debugging our programs for a long while now.
But there is also assert and doAssert
Here is an example of assert:
assert1 == 1
How this works is that, if the condition is true, nothing will happen, the program will simply continue.
But if the condition is false, then you will get an error like this:
assert0 == 1
assert only works in the default debug mode -d:debug(terminal, config.nims gets extra - --d:debug).
It gets ignored by the compiler.
Now there is also doAssert, which stays in the release version -d:release of your program.
1.2. debugEcho and No Side Effects programming
There is another type of echo called debugEcho which pretends to be of no side effects,
in order for it to work with procs marked with {.noSideEffect.} pragma.
func keyword that can be used in place of proc, simply means proc myProc(arg: type) {.noSideEffect.} =.
And {.noSideEffect.} pragma means that this proc will use the functional programming paradigm's,
no side effects term. Which means, that if a proc with no side effects pragma or a func,
is given parameters, and if those parameters are the same, it should always return the same output.
And it should NOT modify any outside state, e.g. writting to the stdout.
This is MOSTLY true in Nim, but Nim is NOT a functional programming language.
It only has some features of one as an addon to make it better.
Here is an example:
Let's demonstrate this no side effects term, by making a proc that writes to the stdout,
by either using echo or stdout.write/.writeln, running it, and then changing the proc to a func,
and or adding the {.noSideEffect.} pragma:
Now the warning is silenced, and we can compile, BUT it will have side effects!
(you may double check that yourself)
1.3. Sugar module's dump macro
dump macro takes identifiers/variables and uses echo to,
print out the name and the value of the variables given in the following pattern (a, b) = (aVal, bVal).
Here is an example:
I don't recommend using it with multiple variables with complex values at the same time.
It will get confusing, because you will read the variable on the left,
then search trough a lot of data on the right, instead of simply having each variable on it's own line.
I recommend using it for a single variable at a time, and with that, the pattern is simply varName = value.
Here is an example:
aVar.dump
aVar = 101
1.4. Sugar module's dumpToString macro
dumpToString macro functions differently to the dump macro.
It does not call echo to display variable names and their values.
Instead it returns a string, whilst also expanding templates and macros(similar to calling repr on them).
Here is an example:
A little bit of an odd output, the name of the variable is outputted twice...
I personally prefer the dump macro for singular variables,
but since this one doesn't call echo and expands templates and macros,
you can use it in more freeing and useful ways.
Here is an example with calling dumpToString on a template calling a proc:
proc sum(a, b: int): int =
a + b
template varPassTrough(variable: untyped): untyped =
sum(variable, variable)
echo varPassTrough(someVar)
echo varPassTrough(someVar).dumpToString
With dumpToString you will know what is going on within your templates etc,
by seeing the name of procs being used and with what arguments.
1.5. astToStr proc
astToStr proc takes the name of an identifier like var and let,
and returns the name of the identifier. This is very useful for debugging,
because, let's say that you had lots of variables you wanted to know their values of at all times.
Now you would first form 1x echo call, then copy paste it and then change the variables.
And if you also wanted to know what variable's value you are displaying,
you would have to manually write it as a string. But with astToStr you wouldn't have to.
For that reason, here in an example of astToStr with a template for displaying the name of the variable,
the type, and it's value:
template dbgMsg(varName: untyped) =
echo varName.astToStr, " of type ", varName.typeof, " of value ", varName
var myVar: float = 0.99let myLet: float = 0.99const myConst: float = 0.99
myVar.dbgMsg
myLet.dbgMsg
myConst.dbgMsg #Doesn't work with constants, returns the value instead of the name
myVar of type float of value 0.99
myLet of type float of value 0.99
0.99 of type float of value 0.99
2. Unit testing
A more advanced way of debugging your programs is called unit testing by the usage of the unittest module.
Unit testing is the method that the vast majority of other programming languages use,
and so Nim also has it.
Unit testing works somewhat like using assert, but it has more options like not quiting on a failed test,
and displaying what exactly failed.
Unit testing is not meant to stay in your programs in release versions, but to iron out the bugs before it gets to that.
2.1. suite template
To start a unit test, you need to call the suite template to start a block of unit testing code like this:
import std/unittest
suite "My tests":
discard
[Suite] My tests
As you can see, you have to name your suite, which serves as basically a collection of tests you will perform.
2.2. test template
To begin unittesting our code, we need to use the test template for our tests which we also have to name.
The test template then starts a test of the following block of code. And will return [OK], or [FAILED],
depending on the checked code inside of it.
suite "My tests":
test "Must be true":
discard
[Suite] My tests
[OK] Must be true
2.3. require template
One can use the require template of type bool, to which we have to specify what value we want it to be, true or false.
Then this condition needs to be of that bool value otherwise the test fails.
This is meant for code that is crucial for your program, that if it fails, there is no point in running anymore tests.
suite "My tests":
test "Must be true":
require(true)
[Suite] My tests
[OK] Must be true
2.4. check and setup templates
Now to check values to be of the desired value you want for the functionality of your program,
there is the check template.
You can also use the setup section for a suite, to for example declare variables you want to use in testing,
those variables will be available to ALL of your tests. You can also create variables inside tests,
but those will be local/available only to that test.
It is also ran before EVERY test, on top of the fact that is will run once after the start of the suite.
Here is an example of check and setup templates:
suite "My tests":
setup:
let fruit = ["apple", "banana", "kiwi", "mango"]
var kFruit: string
test "Must be true":
require(true)
test """Fruit starting with the letter "k" """:
for f in fruit:
if $f[0] == "k":
kFruit = f
check kFruit == "kiwi"
[Suite] My tests
[OK] Must be true
[OK] Fruit starting with the letter \"k\"
2.5. expect template
The expect template which tries to catch an exception(a type of error),
and if a specified exception is raised/caught, the test of expect will pass,
otherwise if the exception/error is NOT of the type specified, or if there isn't one at all, it will fail.
Here is an example:
suite "My tests":
test "Index out of bounds":
let numbers = @[0, 1, 2] #Does NOT work with [0, 1, 2] array - no exceptions for IOOB arrays
expect(IndexDefect): # IOOB - index out of bounds, because IOOB on arrays,discard numbers[3] # can always be found at compilation
[Suite] My tests
[OK] Index out of bounds
Here is an example of a failed check and a failed expect:
suite "Failed expect and check":
test "Failed check":
check(1 == 2)
test "Failed expect": #Because it expects IndexDefect(IOOB)let numbers = @[0, 1, 2]
expect(IndexDefect):
discard numbers[0]
The checkpoint proc will print out all of the checkpoints set before a [FAILURE] occurs inside either a test,
or a check template. It will NOT display [FAILURE], but instead, just the unittest error message:
Just like how the setup proc is ran BEFORE every test, the teardown proc is ran AFTER every test,
but not after the end of the suite. In other words setup is ran before 1 + numberOfTests,
while teardown is ran after numberOfTests.
Here is an example:
suite "Setup and teardown example":
setup:
echo"Ran BEFORE every test AND at the beginning of the `suite`"
teardown:
echo"Ran AFTER every test"
test "Simple arithmetic check":
check(1 == 1)
test "Just another test":
check("a" == "a")
test "Yet another test":
check(1 == 2) #_FAILEDecho"Code put inside a suite, but OUTSIDE all of the tests, is also ran only once"
[Suite] Setup and teardown example
Ran BEFORE every test AND at the beginning of the `suite`
Ran AFTER every test
[OK] Simple arithmetic check
Ran BEFORE every test AND at the beginning of the `suite`
Ran AFTER every test
[OK] Just another test
Ran BEFORE every test AND at the beginning of the `suite`
g:\\Nim\\Nim YouTube Projects\\Current Projects\\Nim's Debugging Methods\\NimsDebuggingMethods.nim(635, 14): Check failed: 1 == 2
Ran AFTER every test
[FAILED] Yet another test
Code put inside a suite, but OUTSIDE all of the tests, is also ran only once
The output is a bit confusing, because all of the echoes are happening before the [OK] outputs.
But that is just because the [OK] flag is outputted AFTER the entire test is finished, including the setup and teardown.
This is demonstrated very well with the one [FAILED] at the bottom.
First the setup's echo triggers, then the error, then the teardown and finally the [FAILED] flag.
3. Stack tracing
3.1. Explanation
Stack tracing is getting a report of the current active frame being executed by the compiler.
That stack trace contains everything from the start to finish of a call like a proc call.
So for example calling echo proc, will return everything that happened inside that echo,
including any other proc calls like this:
var variable = 10.5echo variable.int, " or as a proc call: ", variable.toInt
10 or as a proc call: 11
The first variable.int of value 10.5 float becomes 10 int,
because we simply ignore everything after the decimal point.
While the second type conversion using a proc call of toInt, does some rounding,
which appears to round up.
(if you change it to anything lower than 10.5 it will round down to 10)
A proc call inside a proc call will have it's own stack trace,
but it will also be nested inside the previous proc call, all the way to the top level proc call(not nested).
This is similar to how we can nest conditional statements.
If you have a top level(not nested) conditional that also has another conditional inside of it,
well the nested one has it's own code, but is also inside the top level one.
if1 == 1:
echo"1 is 1"if2 == 2:
echo"2 is 2"
1 is 1
2 is 2
3.2. Stack Frame
Every stack trace has the following structure:
A stack traces inside a stack frame(with a frameMsg),
which contains the name of the proc being executed, the line it's from,
and the filename(for when your program is split into multiple and using modules).
With all that said, getting a stack trace or stack trace back can be very useful for debugging,
because you can get the information on where the code crashed, when the compiler can't.
This is especially useful in release mode, which has a lot of the safety measures for debugging,
turned off for reasons of speed. But this has to be done manually by basically setting checkpoints.
3.3. Demonstration
Here is an arbitrary example to demonstrate how stack tracing works:
So the the stack trace starts at the top, stackTracing is the name of the file it's being called from,
and the start of the stack trace.
Then we have checkpoint which calls checkpoint2 in that stack frame.
Here is a more real world example:
import std/strutils
var lowercaseWords = @["program", "nim", "gimp", "computer"]
proc capitalizeAscii(s: string): string =
result = strutils.capitalizeAscii(s)
writeStackTrace()
for lWord in lowercaseWords.mitems: #Modifiableif lWord[0].isLowerAscii:
lWord = lWord.capitalizeAscii #Our capitalizeAsciiecho lowercaseWords
As you can see, we get 4x tracebacks for the 4x lowercaseWords.
This is very useful to determine how many times a loop happened, but more importantly if something weird happened there,
and most importantly, when the crash/error happened. For example, the program could run several times just fine,
but then some data wasn't correct for a proc and a crash happened.
If this happened inside a loop going trough a VERY large collection of data, it would be like finding a needle in a haystack.
Here is an example of just that, an error inside a loop:
import std/strutils
# 0 1 2 3 4 5 6 7 8 9 10 11 12var integersToParse = @["1", "25", "101", "68", "-100", "75", "33", "-17", "10.1", "99", "-44", "0", "2"]
var parsedIntegers: seq[int]
proc parseInt(s: string): int =
result = strutils.parseInt(s) #This one is a proc {.noSideEffect.}
writeStackTrace()
for number in integersToParse:
parsedIntegers.add number.parseInt #Our parseIntecho parsedIntegers
Now, this example doesn't have a big enough of a collection of data that you couldn't find the problem quickly.
But it should demonstrate that, if that collection of data was in the hundreds, thousands and more,
it would take just way too much time.
And with that, stack tracing found the problem easily. Index 8 of "10.1" is a float when parsed, not an int.
4. Code Usage Profiling
This method will measure in % the amount of processing was spent of the total on a given call(stack trace).
To do this, we will have to import std/nimprof Nim's embedded profiler,
and enable it and stack tracing with the following flags inside a config.nims file:
--profiler:on
--stackTrace:on
The following is a sample program that we are going to be using for code usage profiling:
import std/nimprof
import std/strutils
proc letters() =
echo("Found letter")
proc numbers() =
echo("Found number")
proc different() =
echo("Found something else")
proc analyse(data: string) =
var index = 0while index < data.len:
case data[index]
ofLetters: letters()
of {'0' .. '9'}: numbers()
else: different()
index.inc
for index in0 .. 1000:
analyse("uyguhijkmnbreadv44354gasuygi456donkey456uiolkno,.,Ochyqudsayd12635uha")
The above code's results will be inside profile_results.txt file.
Here are the results after completion:
The profiling results are split into 2x parts. The left side contains all the stack traces,
with the percental values on the far left representing the percentage of the TOTAL usage of that stack frame,
relative to the program. So the first stack frame took 41% of the program's total usage
Now the right side shows the percental usage/time spent on each of the proc calls relative to that stack frame.
So the first stack frame spent 86% on the analyse proc.
Profiling with it's near 100% value, is just the profiler, you may completely ignore it.
Then the second stack frame also took the same amount of processing on the analyse proc,
but it also called the numbers proc 28% of the time.
There are just 3 procs inside the nimprof module.
These are the following disableProfiling, enableProfiling and setSamplingFrequency.
You can use the enable and disableProfiling procs to mark only the desired parts of your code to profile.
With all that said, this should of demonstrated how you can use Nim's embedded profiler to find bottle necks in your programs.
5. Time Elapsed Profiling/Benchmarking
I have already shown this in the List Comprehensions with sugar.collect vs Python's List Comprehensions tutorial.
But i have a bit more to say, and it has to included in this tutorial.
Since Nim doesn't have a module specifically for this, this is custom made.
Time elapsed/based benchmarking is used in basically every programming language out there.
But they are often misused, used for comparisons between programming languages.
Because the implementations may vary significantly. E.g. Python is a dynamic programming language,
and with that it is slow. But since it's so popular, it's implementations are VERY optimized using Cython,
that's what the source code of Python is called, since it's written in C.
And with that, the benchmark then becomes a benchmark of implementations instead of languages.
The use case for this compared to an actual external dedicated profiler is,
that this is much easier and simpler to both setup and use. An actual external profiler will have many more features for finding bottle necks.
Features that will find neglected code that a time based/elapsed profiler cannot.
But again a time based/elapsed profiler is very simple, while a dedicated/general profiler can be quite tricky to learn,
and may often be total overkill.
With that said, unless you know there are lots of bottle necks you have to optimize once the bulk of your program is done,
use the simplest tool for the job.
import std/times, std/os, std/strutils, std/sequtils, std/sugar
template benchmark(benchmarkName: string, timesToRun: int, code: untyped) =
block:
let t0 = cpuTime()
for run in0..timesToRun:
code
let elapsed = cpuTime() - t0
let elapsedProcessed = elapsed / timesToRun
let elapsedProcessedStr = elapsedProcessed.formatFloat(format = ffDecimal, precision = 12)
echo"CPU Time [", benchmarkName, "] x ", timesToRun, " = ", elapsedProcessedStr, "s"
benchmark "add ", 10000:
let num = 10000var list: seq[num.typeof]
for j in0..num:
list.add j
benchmark "index ", 10000:
let num = 10000#Initializing a seq of 10000 ups the time by about 3xvar list = newSeqWith(num, 0) #size, default valuefor index, ele in list.pairs:
list[index] = index
benchmark "collect", 10000:
let num = 10000var list = collect:
for i in0..num:
i
CPU Time [add ] x 10000 = 0.000142300000s
CPU Time [index ] x 10000 = 0.000157300000s
CPU Time [collect] x 10000 = 0.000142400000s
Outro - Afterwords
Okay, that's it for this video, thanks for watching like, share and subscribe,
aswell as click the bell icon if you liked it and want more,
you can also support me on Patreon.
If you had any problems with any part of the video,
let me know in the comment section,
the code of this video, script and documentation, are in the link in the description,
as a form of written tutorial.
Thanks to my past and current Patrons
Past Patrons
Goose_Egg: From April 4th 2021 to May 10th 2022
Davide Galilei(1x month)
Current Patrons
jaap groot (from October 2023)
Dimitri Lesnoff (from October 2023)
Compiler Information
Version used: E.G. 2.0.2
Compiler settings used: none, ORC is now the default memory management option(mm:orc)
#Do NOT use {} inside nbText: hlMdF""" """ fields, sometimes it will error, not always#When using - to make a line a list item, you cannot have ANY one of the lines be an empty line#Use spaces by a factor of 2x for indentation in levels# *text* italic# **text** for bold instead of <b></b># ***text*** italic bold#Link 1 - <a href = "link"></a>#Link 2 - [name](link)#Link 3 `name <link>`_ -> without a name works too#nbCodeSkip -> skips the output/echo calls from the file, everything else remains the same#nbCodeInBlock -> opens up a new scope like the "block" statement, useful for when you don't want to use different variable names etc#https://pietroppeter.github.io/nimib/allblocks.html#nbShow is super useful!#<code></code> makes text with a background#https://nim-lang.org/docs/manual.html#lexical-analysis-raw-string-literals raw strings r""import nimib, std/strutils, std/strformat #You can use nimib's custom styling or HTML & CSS
nbInit()
nb.darkMode()
#nbShow() #This will auto open this file in the browser, but it does not check if it is already open#so it keeps bloody opening one after another, i just want a way to update changes quickly# customize source highlighting:
nb.context["highlight"] = """
<link rel="stylesheet" href="https://cdnjs.cloudflare.com/ajax/libs/highlight.js/10.5.0/styles/default.min.css">
<script src="https://cdnjs.cloudflare.com/ajax/libs/highlight.js/10.5.0/highlight.min.js"></script>
<script>hljs.initHighlightingOnLoad();</script>"""# a custom text block that shows markdown sourcetemplate nbTextWithSource*(body: untyped) =
newNbBlock("nbTextWithSource", false, nb, nb.blk, body):
nb.blk.output = body
nb.blk.context["code"] = body
nb.renderPlans["nbTextWithSource"] = @["mdOutputToHtml"]
nb.partials["nbTextWithSource"] = """{{&outputToHtml}}
<pre><code class=\"language-markdown\">{{code}}</code></pre>"""#Overriding nimib's nbCode -> with a version that has horizontal scroll for overflowing outputimport nimib / [capture]
template nbCode(body: untyped) {.used.} =
newNbCodeBlock("nbCode", body): #Writes to stdout `lineNumb typeOfNBblock: a bit of first line
captureStdout(nb.blk.output):
body
nb.partials["nbCode"] = """
{{>nbCodeSource}}
<pre><code class=\"language-markdown\" style = "color:white;background-color: rgba(255, 255, 255, 0);font-size: 12px;">{{>nbCodeOutput}}</code></pre>
"""
nb.renderPlans["nbCode"] = @["highlightCode"] # default partial automatically escapes output (code is escaped when highlighting)# Required to show the code that then gets it's output shown aswell, if empty, empty <code></code> linetemplate colorizeLines(body: untyped): untyped =
var bodyColorized = body.repr
var timesToColorize: intif bodyColorized.count("[Suite]") > 0:
timesToColorize += bodyColorized.count("[Suite]")
if bodyColorized.count("[OK]") > 0:
timesToColorize += bodyColorized.count("[OK]")
if bodyColorized.count("[FAILED]") > 0:
timesToColorize += bodyColorized.count("[FAILED]")
var index = 0var suiteFinalStage = falsevar currentIndex: intwhile index < 1:
# [Suite] if suiteFinalStage == false:
bodyColorized.insert("""<span style = "color: rgba(0, 132, 255, 1)">""", bodyColorized.find("[Suite]"))
bodyColorized.insert("""</span><span style = "color:white";>""", bodyColorized.find("[Suite]") + "[Suite]".len)
suiteFinalStage = trueif bodyColorized.count("[OK]") > 0:
bodyColorized.insert("""</span>""", bodyColorized.find("[OK]"))
currentIndex = bodyColorized.find("[OK]") + "</span>".len-1#Must be -1
index += 1elif bodyColorized.count("[FAILED]") > 0:
bodyColorized.insert("""</span>""", bodyColorized.find("[FAILED]"))
currentIndex = bodyColorized.find("[FAILED]") + "</span>".len-1#Must be -1
index += 1else: #If it only has [Suite] end it, no need to increase the index
bodyColorized.insert("""</span>""", bodyColorized.len-1) #Must be -1
index += 1#-[OK] and [FAILED]
bodyColorized = bodyColorized.replaceWord("[OK]", """<span style = "color: rgba(0, 255, 0, 1)">[OK]</span>""")
bodyColorized = bodyColorized.replaceWord("[FAILED]", """<span style = "color: rgba(255, 0, 0, 1)">[FAILED]</span>""")
#Temporary improvementif bodyColorized.startsWith(""""\n"""):
bodyColorized.delete(0..2)
if bodyColorized.endsWith("""""""):
bodyColorized.delete(bodyColorized.len-1..bodyColorized.len-1)
#Removing raw \n, which are the ones shown
bodyColorized = bodyColorized.replace(r"\n", "")
#Not sure why, but it errors without it
bodyColorized.stripLineEnd
bodyColorized
var output: stringtemplate nbColorizeOutputUT() =
output = nb.blk.output
output = output.colorizeLines
#Clearing old output
nb.blk.output = ""
nb.blk.context["output"] = ""
nbRawHtml: &"""<pre class = "" style = "overflow-x: auto;">{output}</pre>"""#class = "" so we don't get green font# how to add a ToCvar
nbToc: NbBlocktemplate addToc =
newNbBlock("nbText", false, nb, nbToc, ""):
nbToc.output = "## Table of Contents:\n\n"var index = (section: 0, subsection: 0)
template nbSection(name: string) {.used.} =
index.section.inc
index.subsection = 0#Reset on a new nbSectionlet anchorName = name.toLower.replace(" ", "-")
nbText "<a name = \"" & anchorName & "\"></a>\n# " & $index.section & ". " & name & "\n\n---"# see below, but any number works for a numbered list
nbToc.output.add "- " & $index.section & r"\. " & "<a href=\"#" & anchorName & "\">" & name & "</a>\n"#\ is HTML code for "\", you can also "\\" or r"\"#If you get an error from the above line, addToc must be ran before any nbSection template nbSubSection(name: string) {.used.} =
index.subsection.inc
let anchorName = name.toLower.replace(" ", "-")
nbText "<a name = \"" & anchorName & "\"></a>\n## " & " " & $index.section & "." & $index.subsection & ". " & name & "\n\n---"# is inline HTML for a single white space(nothing in markdown)# see below, but any number works for a numbered list
nbToc.output.add " - " & $index.section & r"\." & $index.subsection & r"\. " & "<a href=\"#" & anchorName & "\">" & name & "</a>\n"#If you get an error from the above line, addToc must be ran before any nbSection template nbUoSection(name: string) {.used.} =
nbText "\n# " & name & "\n\n---"template nbUoSubSection(name: string) {.used.} =
nbText "\n## " & name & "\n\n---"template nbCodeSnippet(body: untyped) =
newNbCodeBlock("nbCodeSnippet", body):
nb.blk.output = body
nb.partials["nbCodeSnippet"] = """<pre><code class="hlNim">{{&output}}</code></pre>"""
nb.renderPlans["nbCodeSnippet"] = @["highlightCode"]
#Updating the same file is shown instantly once deployed via Github Page on PC. #Mobile takes either a random amount of time, or NOT at all!template addButtonBackToTop() =
nbRawHtml: hlHtml"""
<meta name = "viewport" content = "width = device-width, initial-scale = 1">
<style>
body {} <!-- This is a comment, this needs to be here body {} -->
#toTop {
display: none;
position: fixed;
bottom: 20px;
right: 30px;
z-index: 99;
font-size: 18px;
border: none;
outline: none;
background-color: #1A222D;
color: white;
cursor: pointer;
padding: 15px;
border-radius: 4px;
}
#toTop:hover {background-color: #555;}
#toTopMobile {
display: none;
position: fixed;
bottom: -5px;
right: -5px;
z-index: 99;
font-size: 18px;
border: none;
outline: none;
background-color: #1A222D;
opacity: .2;
color: white;
cursor: pointer;
padding: 15px;
border-radius: 4px;
}
#toTopMobile:hover {background-color: #555;}
</style>
<body>
<button onclick = "topFunction()" id = "toTop" title = "Go to top">Top</button>
<button onclick = "topFunction()" id = "toTopMobile" title = "Go to top">Top</button>
<script>
// Get the button
let myButton = document.getElementById("toTop");
let myButtonMobile = document.getElementById("toTopMobile");
var currentButton = myButton
var hasTouchScreen = false;
//var contentBody = document.getElementsByTagName("body"); //gives a query object
//myButton.style.color = "red"; //This works
//myButton.textContent = contentBody; //This also works .innerHTML, .innerText
//document.body.scrollTop > 20 || document.documentElement.scrollTop > 20
//Above could be used to position the button relativly ?
// Detecting if the device is a mobile device
if ("maxTouchPoints" in navigator)
{
hasTouchScreen = navigator.maxTouchPoints > 0;
}
else if ("msMaxTouchPoints" in navigator)
{
hasTouchScreen = navigator.msMaxTouchPoints > 0;
}
else
{
var mQ = window.matchMedia && matchMedia("(pointer:coarse)");
if (mQ && mQ.media === "(pointer:coarse)")
{
hasTouchScreen = !!mQ.matches;
}
else if ('orientation' in window)
{
hasTouchScreen = true; // deprecated, but good fallback
}
else
{
// Only as a last resort, fall back to user agent sniffing
var UA = navigator.userAgent;
hasTouchScreen = (
/\b(BlackBerry|webOS|iPhone|IEMobile)\b/i.test(UA) ||
/\b(Android|Windows Phone|iPad|iPod)\b/i.test(UA)
);
}
}
if (hasTouchScreen)
currentButton = myButtonMobile
// When the user scrolls down 20px from the top of the document, show the button
window.onscroll = function()
{
scrollFunction()
};
function scrollFunction()
{
if (document.body.scrollTop > 20 || document.documentElement.scrollTop > 20) {
currentButton.style.display = "block";
} else {currentButton.style.display = "none";}
}
// When the user clicks on the button, scroll to the top of the document
function topFunction() {
document.body.scrollTop = 0;
document.documentElement.scrollTop = 0;
}
</script>
"""#TABLE OF CONTENTS - MUST BE RUN BEFORE ANY nbSection !!!
addToc()
addButtonBackToTop()
#Use Live Preview Extension and set the Auto Refresh Preview set to "On changes to Saved Files"#And Server Keep Alive After Embedded Preview Close set to 0, #so that we no longer need the preview embedded window, we now have it in the browser!#Live SERVER Extension no longer works, even with the .html file kept open################START OF FILE#################Adding hlMd enables nimiboost's markdown highlight mode. hlMdf adds the fmt"{var}" functionality
nbText: hlmdf"""
## INTRO - GREETING
- **Title**: Nim's Debugging Methods
- **Alt Title**: Part 1 of 2(Part 1 is Nim's Debugging Methods); Part 2 is using external debuggers and profilers
- **Prerequired knowledge:** Up to and including: Nim for Beginners List Comprehensions with sugar.collect vs Python's List Comprehensions
## INTRO - FOREWORDS
**(What is the purpose of this video ?)**
- Nim's Debugging Methods:
- In this video we will go over all the debugging methods Nim has specifically.
Actual debuggers and profilers are the subject of a part 2 video.
The code for this video and it's script/documentation styled with nimib,
is in the link in the description as a form of written tutorial.
"""
nbSection "Debugging your programs"
nbSubSection "Simple debugging methods(`echo`, `assert`, `doAssert`)"
nbText: """
We have been using `echo` for debugging our programs for a long while now.
But there is also `assert` and `doAssert`
**Here is an example of `assert`:**
"""
nbCode:
assert1 == 1
nbText: """
How this works is that, if the condition is true, nothing will happen, the program will simply continue.
But if the condition is false, then you will get an error like this:
"""
nbCodeSkip:
assert0 == 1
nbRawHtml: hlhtml"""<img src = "images\assertError.png">"""
nbText: """
`assert` only works in the default debug mode `-d:debug`(terminal, config.nims gets extra `-` --d:debug).
It gets ignored by the compiler.
Now there is also `doAssert`, which stays in the release version `-d:release` of your program.
"""
nbSubSection "`debugEcho` and No Side Effects programming"
nbText: """
There is another type of `echo` called `debugEcho` which pretends to be of no side effects,
in order for it to work with `procs` marked with {.noSideEffect.} pragma.
`func` keyword that can be used in place of `proc`, simply means `proc myProc(arg: type) {.noSideEffect.} =`.
And {.noSideEffect.} pragma means that this proc will use the `functional` programming paradigm's,
no side effects term. Which means, that if a proc with no side effects pragma or a func,
is given parameters, and if those parameters are the same, it should always return the same output.
And it should NOT modify any outside state, e.g. writting to the `stdout`.
This is MOSTLY true in Nim, but Nim is NOT a functional programming language.
It only has some features of one as an addon to make it better.
**Here is an example:**
Let's demonstrate this no side effects term, by making a proc that writes to the `stdout`,
by either using `echo` or `stdout.write`/`.writeln`, running it, and then changing the proc to a `func`,
and or adding the {.noSideEffect.} pragma:
"""
nbCode:
proc writeToStdout() =
echo"Hello"
writeToStdout()
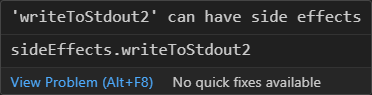
nbCodeSkip:
func writeToStdout2() =
echo"Hello"
writeToStdout2()
nbRawHtml: hlhtml"""<img src = "images\sideEffects.png">"""
nbRawHtml: hlhtml"""<img src = "images\sideEffectsError.png">"""
nbText: """
Error, will not compile.
"""
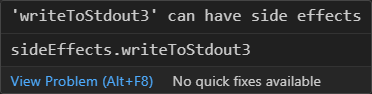
nbCodeSkip:
proc writeToStdout3() {.noSideEffect.} =
echo"Hello"
writeToStdout3()
nbRawHtml: hlhtml"""<img src = "images\sideEffects2.png">"""
nbRawHtml: hlhtml"""<img src = "images\sideEffectsError2.png">"""
nbText: """
Error, will not compile.
"""
nbCode:
proc writeToStdout4() {.noSideEffect.} =
  debugEcho "Hello"

writeToStdout4()
nbText: """
Now the warning is silenced, and we can compile, **BUT it will have side effects!**
<h6>(you may double check that yourself)</h6>
"""
nbSubSection "Sugar module's `dump` macro"
nbText: """
`dump` macro takes identifiers/variables and uses `echo` to,
print out the name and the value of the variables given in the following pattern `(a, b) = (aVal, bVal)`.
**Here is an example:**
"""
nbCode:
import std/sugar
var aVar = 101let aLet = 202const aConst = 303
dump (aVar, aLet, aConst) #Requires parentheses
nbText: """
I don't recommend using it with multiple variables with complex values at the same time.
It will get confusing, because you will read the variable on the left,
then search trough a lot of data on the right, instead of simply having each variable on it's own line.
I recommend using it for a single variable at a time, and with that, the pattern is simply `varName = value`.
**Here is an example:**
"""
nbCode:
aVar.dump
nbSubSection "Sugar module's `dumpToString` macro"
nbText: """
`dumpToString` macro functions differently to the `dump` macro.
It does not call `echo` to display variable names and their values.
Instead it returns a string, whilst also expanding templates and macros(similar to calling repr on them).
**Here is an example:**
"""
nbCode:
typeMyObject = object
name: string
value: intvar myObject = MyObject(name: "Hello", value: 101)
echo myObject.dumpToString
var someVar = 101echo someVar.dumpToString
echo myObject.dumpToString, someVar.dumpToString
nbText: """
A little bit of an odd output, the name of the variable is outputted twice...
I personally prefer the `dump` macro for singular variables,
but since this one doesn't call `echo` and expands templates and macros,
you can use it in more freeing and useful ways.
**Here is an example with calling `dumpToString` on a template calling a proc:**
"""
nbCode:
proc sum(a, b: int): int =
  a + b

template varPassTrough(variable: untyped): untyped =
  sum(variable, variable)

echo varPassTrough(someVar)
echo varPassTrough(someVar).dumpToString
nbText: """
With `dumpToString` you will know what is going on within your templates etc,
by seeing the name of procs being used and with what arguments.
"""
nbSubSection "`astToStr proc`"
nbText: """
`astToStr` proc takes the name of an identifier like `var` and `let`,
and returns the name of the identifier. This is very useful for debugging,
because, let's say that you had lots of variables you wanted to know their values of at all times.
Now you would first form 1x echo call, then copy paste it and then change the variables.
And if you also wanted to know what variable's value you are displaying,
you would have to manually write it as a string. But with `astToStr` you wouldn't have to.
**For that reason, here in an example of `astToStr` with a template for displaying the name of the variable,
the type, and it's value:**
"""
nbCode:
template dbgMsg(varName: untyped) =
echo varName.astToStr, " of type ", varName.typeof, " of value ", varName
var myVar: float = 0.99let myLet: float = 0.99const myConst: float = 0.99
myVar.dbgMsg
myLet.dbgMsg
myConst.dbgMsg #Doesn't work with constants, returns the value instead of the name
nbSection "Unit testing"
nbText: """
A more advanced way of debugging your programs is called `unit testing` by the usage of the `unittest` module.
Unit testing is the method that the vast majority of other programming languages use,
and so Nim also has it.
Unit testing works somewhat like using `assert`, but it has more options like not quiting on a failed test,
and displaying what exactly failed.
Unit testing is not meant to stay in your programs in release versions, but to iron out the bugs before it gets to that.
"""
nbSubSection "`suite` template"
nbText: """
To start a unit test, you need to call the `suite` template to start a block of unit testing code like this:
"""
nbCode:
import std/unittest

suite "My tests":
  discard
nbColorizeOutputUT #TODO - our template makes an extra line... if we delete the first 2 indexes, we delete <s ...
nbText: """
As you can see, you have to name your `suite`, which serves as basically a collection of tests you will perform.
"""
nbSubSection "`test` template"
nbText: """
To begin unittesting our code, we need to use the `test` template for our tests which we also have to name.
The `test` template then starts a test of the following block of code. And will return [OK], or [FAILED],
depending on the checked code inside of it.
"""
nbCode:
suite "My tests":
  test "Must be true":
    discard
nbColorizeOutputUT
nbSubSection "`require` template"
nbText: """
One can use the `require` template of type bool, to which we have to specify what value we want it to be, true or false.
Then this condition needs to be of that bool value otherwise the test fails.
This is meant for code that is crucial for your program, that if it fails, there is no point in running anymore tests.
"""
nbCode:
suite "My tests":
  test "Must be true":
    require(true)
nbColorizeOutputUT
nbSubSection "`check` and `setup` templates"
nbText: """
Now to check values to be of the desired value you want for the functionality of your program,
there is the `check` template.
You can also use the `setup` section for a `suite`, to for example declare variables you want to use in testing,
those variables will be available to ALL of your tests. You can also create variables inside tests,
but those will be local/available only to that test.
It is also ran before EVERY test, on top of the fact that is will run once after the start of the `suite`.
**Here is an example of `check` and `setup` templates:**
"""
nbCode:
suite "My tests":
  setup:
    let fruit = ["apple", "banana", "kiwi", "mango"]
    var kFruit: string
  test "Must be true":
    require(true)
  test """Fruit starting with the letter "k" """:
    for f in fruit:
      if $f[0] == "k":
        kFruit = f
    check kFruit == "kiwi"
nbColorizeOutputUT
nbSubSection "`expect` template"
nbText: """
The `expect` template which tries to catch an exception(a type of error),
and if a specified exception is raised/caught, the test of `expect` will pass,
otherwise if the exception/error is NOT of the type specified, or if there isn't one at all, it will fail.
**Here is an example:**
"""
nbCode:
suite "My tests":
test "Index out of bounds":
let numbers = @[0, 1, 2] #Does NOT work with [0, 1, 2] array - no exceptions for IOOB arrays
expect(IndexDefect): # IOOB - index out of bounds, because IOOB on arrays,discard numbers[3] # can always be found at compilation
nbColorizeOutputUT
nbText: """
Here is an example of a failed `check` and a failed `expect`:
"""
nbCode:
suite "Failed expect and check":
test "Failed check":
check(1 == 2)
test "Failed expect": #Because it expects IndexDefect(IOOB)let numbers = @[0, 1, 2]
expect(IndexDefect):
discard numbers[0]
nbColorizeOutputUT #TODO weirdly almost all of it is green colorized without using the nbColorizeOutputUT
nbSubSection "`checkpoint` proc"
nbText: """
The `checkpoint` proc will print out all of the checkpoints set before a [FAILURE] occurs inside either a `test`,
or a `check` template. It will NOT display [FAILURE], but instead, just the unittest error message:
"""
nbCode:
suite "Checkpoints":
  checkpoint("Checkpoint Start")
  checkpoint("Checkpoint 2")
  check((101, "Hello World!") == (1, "Hello"))
  checkpoint("Checkpoint 3")   #Gets ignored
  checkpoint("Checkpoint End") #Gets ignored
nbColorizeOutputUT
nbText: """
If we then make the `check` succeed, none of the checkpoints will be shown.
"""
nbCode:
suite "Checkpoints":
  checkpoint("Checkpoint Start")
  checkpoint("Checkpoint 2")
  check((101, "Hello World!") == (101, "Hello World!"))
  checkpoint("Checkpoint 3")   #Gets ignored
  checkpoint("Checkpoint End") #Gets ignored
nbColorizeOutputUT
nbSubSection "`teardown` proc"
nbText: """
Just like how the `setup` proc is ran BEFORE every test, the `teardown` proc is ran AFTER every test,
but not after the end of the `suite`. In other words `setup` is ran before `1 + numberOfTests`,
while `teardown` is ran after `numberOfTests`.
**Here is an example:**
"""
nbCode:
suite "Setup and teardown example":
setup:
echo"Ran BEFORE every test AND at the beginning of the `suite`"
teardown:
echo"Ran AFTER every test"
test "Simple arithmetic check":
check(1 == 1)
test "Just another test":
check("a" == "a")
test "Yet another test":
check(1 == 2) #_FAILEDecho"Code put inside a suite, but OUTSIDE all of the tests, is also ran only once"
nbColorizeOutputUT
nbText: """
The output is a bit confusing, because all of the echoes are happening before the `[OK]` outputs.
But that is just because the `[OK]` flag is outputted AFTER the entire test is finished, including the `setup` and `teardown`.
This is demonstrated very well with the one `[FAILED]` at the bottom.
First the `setup`'s echo triggers, then the error, then the `teardown` and finally the `[FAILED]` flag.
"""
nbSection "Stack tracing"
nbSubSection "Explanation"
nbText: """
Stack tracing is getting a report of the current active frame being executed by the compiler.
That stack trace contains everything from the start to finish of a call like a `proc call`.
So for example calling `echo` proc, will return everything that happened inside that echo,
including any other `proc` calls like this:
"""
nbCode:
var variable = 10.5echo variable.int, " or as a proc call: ", variable.toInt
nbText: """
The first `variable.int` of value `10.5 float` becomes `10 int`,
because we simply ignore everything after the decimal point.
While the second type conversion using a proc call of `toInt`, does some rounding,
which appears to round up.
<h6>(if you change it to anything lower than 10.5 it will round down to 10)</h6>
A proc call inside a proc call will have it's own stack trace,
but it will also be nested inside the previous proc call, all the way to the top level proc call(not nested).
This is similar to how we can nest conditional statements.
If you have a top level(not nested) conditional that also has another conditional inside of it,
well the nested one has it's own code, but is also inside the top level one.
"""
nbCode:
if1 == 1:
echo"1 is 1"if2 == 2:
echo"2 is 2"
nbSubSection "Stack Frame"
nbText: """
Every stack trace has the following structure:
A stack traces inside a stack frame(with a frameMsg),
which contains the name of the `proc` being executed, the line it's from,
and the filename(for when your program is split into multiple and using modules).
With all that said, getting a `stack trace` or `stack trace back` can be very useful for debugging,
because you can get the information on where the code crashed, when the compiler can't.
This is especially useful in release mode, which has a lot of the safety measures for debugging,
turned off for reasons of speed. But this has to be done manually by basically setting checkpoints.
"""
nbSubSection "Demonstration"
nbText: """
Here is an arbitrary example to demonstrate how stack tracing works:
"""
nbCode:
proc checkpoint2() =
  writeStackTrace()

proc checkpoint() =
  checkpoint2()

checkpoint()
nbRawHtml: hlhtml"""<img src = "images\stackTracing.png">"""
nbText: """
So the the stack trace starts at the top, `stackTracing` is the name of the file it's being called from,
and the start of the stack trace.
Then we have `checkpoint` which calls `checkpoint2` in that stack frame.
**Here is a more real world example:**
"""
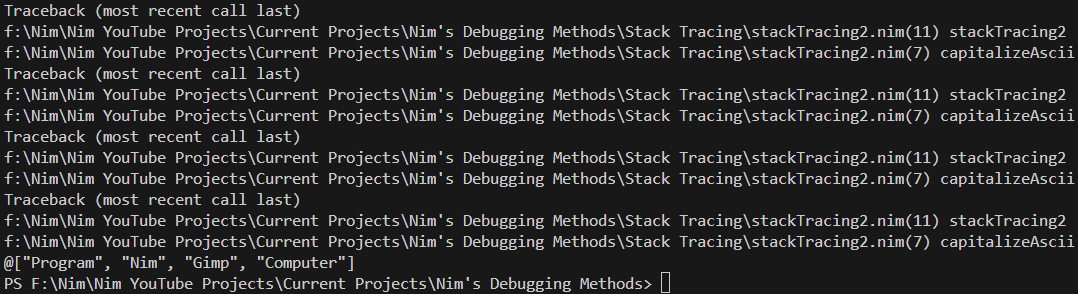
nbCodeSkip:
import std/strutils
var lowercaseWords = @["program", "nim", "gimp", "computer"]
proc capitalizeAscii(s: string): string =
result = strutils.capitalizeAscii(s)
writeStackTrace()
for lWord in lowercaseWords.mitems: #Modifiableif lWord[0].isLowerAscii:
lWord = lWord.capitalizeAscii #Our capitalizeAsciiecho lowercaseWords
nbRawHtml: hlhtml"""<img src = "images\stackTracing2.png">"""
nbText: """
As you can see, we get 4x tracebacks for the 4x lowercaseWords.
This is very useful to determine how many times a loop happened, but more importantly if something weird happened there,
and most importantly, when the crash/error happened. For example, the program could run several times just fine,
but then some data wasn't correct for a proc and a crash happened.
If this happened inside a loop going trough a VERY large collection of data, it would be like finding a needle in a haystack.
**Here is an example of just that, an error inside a loop:**
"""
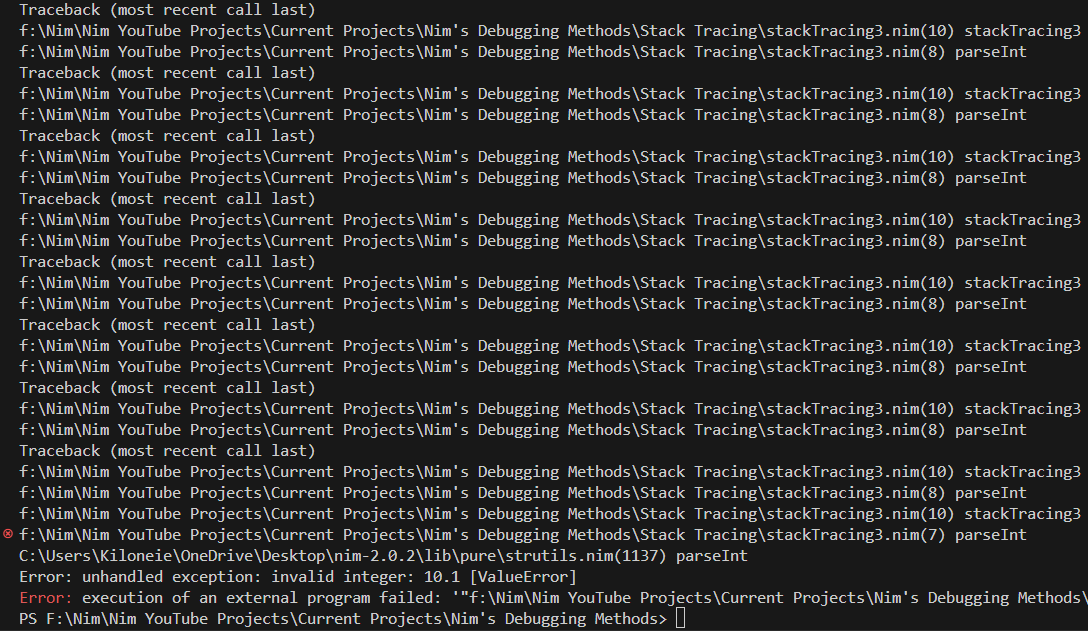
nbCodeSkip:
import std/strutils
# 0 1 2 3 4 5 6 7 8 9 10 11 12var integersToParse = @["1", "25", "101", "68", "-100", "75", "33", "-17", "10.1", "99", "-44", "0", "2"]
var parsedIntegers: seq[int]
proc parseInt(s: string): int =
result = strutils.parseInt(s) #This one is a proc {.noSideEffect.}
writeStackTrace()
for number in integersToParse:
parsedIntegers.add number.parseInt #Our parseIntecho parsedIntegers
nbRawHtml: hlhtml"""<img src = "images\stackTracing3.png">"""
nbText: """
Now, this example doesn't have a big enough of a collection of data that you couldn't find the problem quickly.
But it should demonstrate that, if that collection of data was in the hundreds, thousands and more,
it would take just way too much time.
And with that, stack tracing found the problem easily. Index 8 of `"10.1"` is a float when parsed, not an int.
"""
nbSection "Code Usage Profiling"
nbText: """
This method will measure in % the amount of processing was spent of the total on a given call(stack trace).
To do this, we will have to `import std/nimprof` Nim's embedded profiler,
and enable it and stack tracing with **the following flags inside a `config.nims` file:**
"""
nbCodeSkip:
--profiler:on
--stackTrace:on
nbText: """
The following is a sample program that we are going to be using for code usage profiling:
"""
nbCodeSkip:
import std/nimprof
import std/strutils
proc letters() =
echo("Found letter")
proc numbers() =
echo("Found number")
proc different() =
echo("Found something else")
proc analyse(data: string) =
var index = 0while index < data.len:
case data[index]
ofLetters: letters()
of {'0' .. '9'}: numbers()
else: different()
index.inc
for index in0 .. 1000:
analyse("uyguhijkmnbreadv44354gasuygi456donkey456uiolkno,.,Ochyqudsayd12635uha")
nbText: """
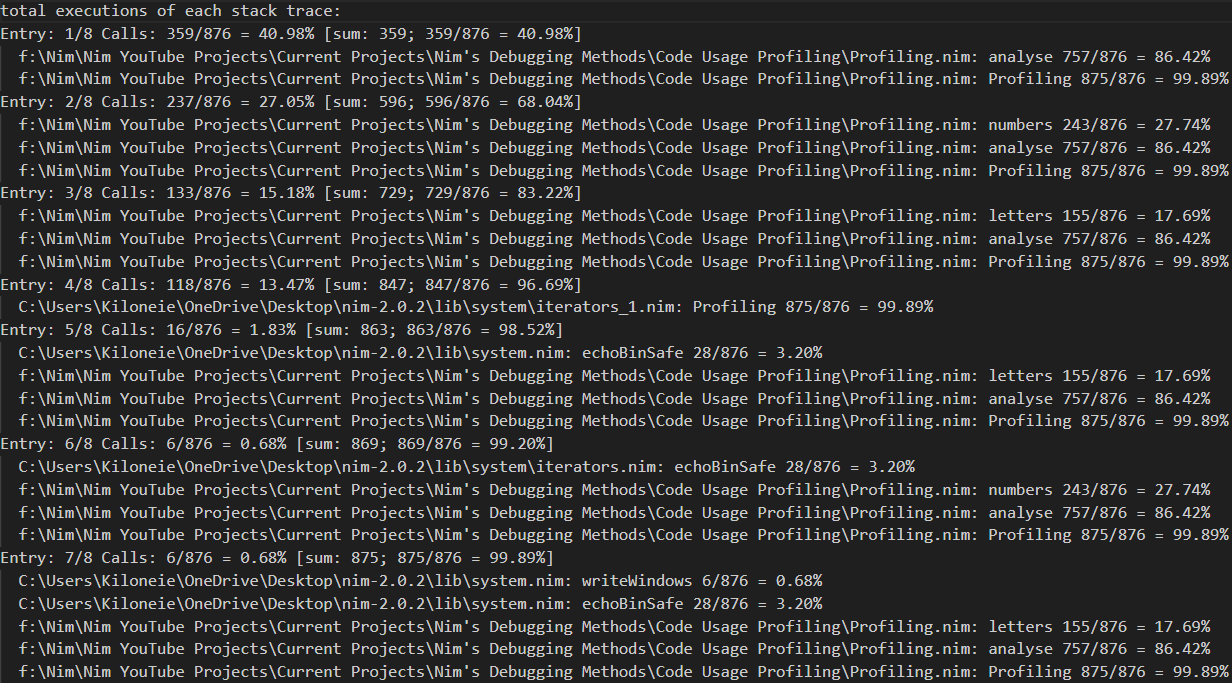
The above code's results will be inside `profile_results.txt` file.
**Here are the results after completion:**
"""
nbRawHtml: hlhtml"""<img src = "images\codeUsageProfilingResults.png">"""
nbRawHtml: hlhtml"""<img src = "images\codeUsageProfilingResultsLeftSide.png">"""
nbText: """
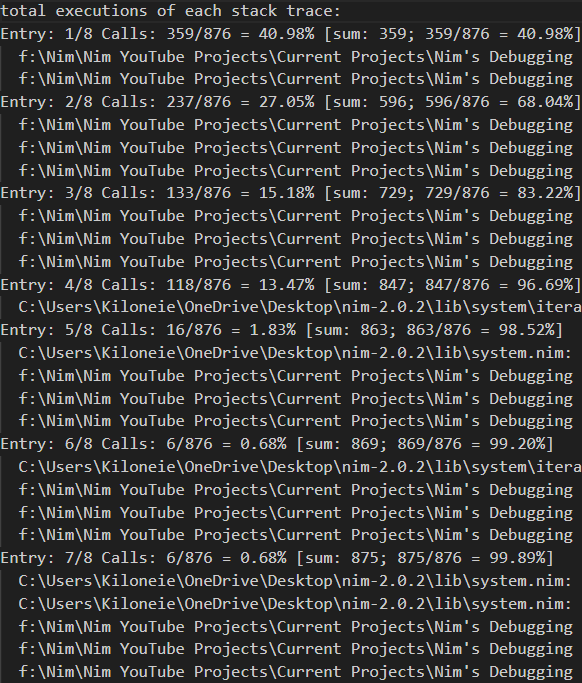
The profiling results are split into 2x parts. The left side contains all the stack traces,
with the percental values on the far left representing the percentage of the TOTAL usage of that stack frame,
relative to the program. So the first stack frame took 41% of the program's total usage
"""
nbRawHtml: hlhtml"""<img src = "images\codeUsageProfilingResultsRightSide.png">"""
nbText: """
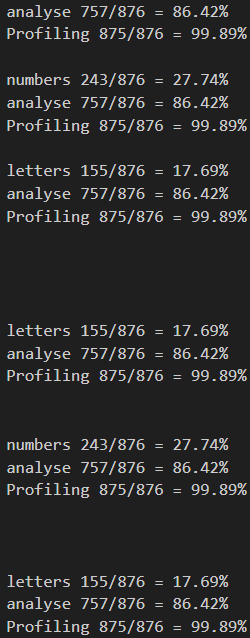
Now the right side shows the percental usage/time spent on each of the `proc calls` relative to that stack frame.
So the first stack frame spent 86% on the `analyse proc`.
`Profiling` with it's near 100% value, is just the profiler, you may completely ignore it.
Then the second stack frame also took the same amount of processing on the `analyse proc`,
but it also called the `numbers proc` 28% of the time.
There are just 3 procs inside the `nimprof` module.
These are the following `disableProfiling`, `enableProfiling` and `setSamplingFrequency`.
You can use the enable and disableProfiling procs to mark only the desired parts of your code to profile.
With all that said, this should of demonstrated how you can use Nim's embedded profiler to find bottle necks in your programs.
"""
nbSection "Time Elapsed Profiling/Benchmarking"
nbText: """
I have already shown this in the `List Comprehensions with sugar.collect vs Python's List Comprehensions` tutorial.
But i have a bit more to say, and it has to included in this tutorial.
Since Nim doesn't have a module specifically for this, this is custom made.
Time elapsed/based benchmarking is used in basically every programming language out there.
But they are often misused, used for comparisons between programming languages.
Because the implementations may vary significantly. E.g. Python is a dynamic programming language,
and with that it is slow. But since it's so popular, it's implementations are VERY optimized using `Cython`,
that's what the source code of Python is called, since it's written in `C`.
And with that, the benchmark then becomes a benchmark of implementations instead of languages.
The use case for this compared to an actual external dedicated profiler is,
that this is much easier and simpler to both setup and use. An actual external profiler will have many more features for finding bottle necks.
Features that will find neglected code that a time based/elapsed profiler cannot.
But again a time based/elapsed profiler is very simple, while a dedicated/general profiler can be quite tricky to learn,
and may often be total overkill.
With that said, unless you know there are lots of bottle necks you have to optimize once the bulk of your program is done,
use the simplest tool for the job.
"""
nbCodeSkip:
import std/times, std/os, std/strutils, std/sequtils, std/sugar
template benchmark(benchmarkName: string, timesToRun: int, code: untyped) =
block:
let t0 = cpuTime()
for run in0..timesToRun:
code
let elapsed = cpuTime() - t0
let elapsedProcessed = elapsed / timesToRun
let elapsedProcessedStr = elapsedProcessed.formatFloat(format = ffDecimal, precision = 12)
echo"CPU Time [", benchmarkName, "] x ", timesToRun, " = ", elapsedProcessedStr, "s"
benchmark "add ", 10000:
let num = 10000var list: seq[num.typeof]
for j in0..num:
list.add j
benchmark "index ", 10000:
let num = 10000#Initializing a seq of 10000 ups the time by about 3xvar list = newSeqWith(num, 0) #size, default valuefor index, ele in list.pairs:
list[index] = index
benchmark "collect", 10000:
let num = 10000var list = collect:
for i in0..num:
i
#This takes a bit, so for reasons of speed when working on this tutorial, this is the first run captured
nbRawHtml: """
<pre>
CPU Time [add    ] x 10000 = 0.000142300000s
CPU Time [index  ] x 10000 = 0.000157300000s
CPU Time [collect] x 10000 = 0.000142400000s
</pre>
"""
nbUoSection "Outro - Afterwords"
nbText: """
Okay, that's it for this video, thanks for watching like, share and subscribe,
aswell as click the bell icon if you liked it and want more,
you can also support me on Patreon.
If you had any problems with any part of the video,
let me know in the comment section,
the code of this video, script and documentation, are in the link in the description,
as a form of written tutorial.
"""
nbUoSection "Thanks to my past and current Patrons"
nbUoSubSection "Past Patrons"
nbText: """
- Goose_Egg: From April 4th 2021 to May 10th 2022
- Davide Galilei(1x month)
"""
nbUoSubSection "Current Patrons"
nbText: """
- jaap groot (from October 2023)
- Dimitri Lesnoff (from October 2023)
"""
nbUoSubSection "Compiler Information"
nbText: """
- Version used: E.G. 2.0.2
- Compiler settings used: none, ORC is now the default memory management option(mm:orc)
"""
nbUoSubSection "My and General Links"
nbText: """
- [Patreon](https://www.patreon.com/Kiloneie?fan_landing=true "Patreon")
- [Visual Studio Code Shortcuts](https://code.visualstudio.com/shortcuts/keyboard-shortcuts-windows.pdf "Visual Studio Code Shortcuts")
"""
nbUoSubSection "Links to this video's subject:"
nbText: """
- [dump macro](https://nim-lang.org/docs/sugar.html#dump.m%2Cuntyped)
- [dumpToString macro](https://nim-lang.org/docs/sugar.html#dumpToString.m%2Cuntyped)
- [unittest module for advanced testing of your code](https://nim-lang.org/docs/unittest.html)
- [unittest 2 potential candidate to replace unittest](https://github.com/status-im/nim-unittest2)
- [Nim's embedded profiler](https://nim-lang.org/docs/nimprof.html)
- [Embedded Stack Trace Profiler (ESTP) User Guide](https://nim-lang.org/docs/estp.html)
"""
nbUoSubSection "Stack Tracing procs, etc -> (system module)"
nbText: """
- [StackTraceEntry object](https://nim-lang.org/docs/nimprof.html)
- [getStackTrace proc](https://nim-lang.org/docs/system.html#getStackTrace)
- [getStackTraceEntries](https://nim-lang.org/docs/system.html#getStackTraceEntries)
- [nimGC_setStackBottom](https://nim-lang.org/docs/system.html#nimGC_setStackBottom%2Cpointer)
- [stackTraceAvailable](https://nim-lang.org/docs/system.html#nimGC_setStackBottom%2Cpointer)
- [writeStackTrace](https://nim-lang.org/docs/system.html#writeStackTrace)
"""
nbSave()